
Gambar:Butterworth response.svg

Ukuran ieu pramidang PNG ti ieu berkas SVG: 512 × 384 pixel Resolusi lianna: 320 × 240 pixel | 640 × 480 pixel | 1.024 × 768 pixel | 1.280 × 960 pixel | 2.560 × 1.920 pixel.
Berkas asli (Koropak SVG, nominalna 512 × 384 piksel, ukuranana 41 KB)
| Berkas ieu asalna ti Wikimedia Commons. Kaca ngeunaan katerangan berkas ieu di Commons aya disalin di handap. Commons téh hiji gudang berkas bébas nu eusina disumbang ku balaréa. |
Ringkesna
| Pedaran |
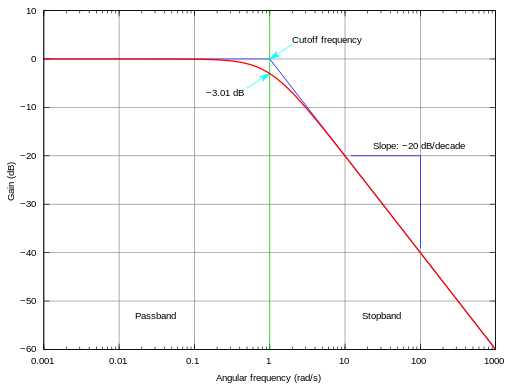
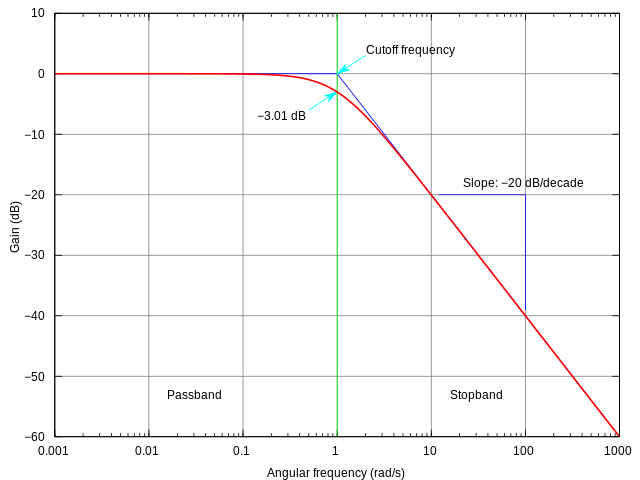
English: This is the SVG version of the PNG image created by Omegatron.
I simply changed the terminal type from PostScript to SVG in the gnuplot script file. The frequency response of a Butterworth filter with logarithmic axes (Bode plot) and various labels. Cutoff frequency is normalized to 1 rad/s. Gain is normalized to 0 dB in the passband.
|
||||
| Titimangsa | (UTC) | ||||
| Sumber | |||||
| Pangarang |
|
||||
| Versi lainnya |
|
||||
| gnuplot source | click to expand
set samples 2001
# set terminal postscript enhanced landscape color lw 2 "Times-Roman" 20
set terminal svg size 800 600 dynamic enhanced
set output "butterworth.svg"

# Butterworth amplitude response and decibel calculation.  n is the order, which is just 1 in this image.
G(w,n) = 1 / (sqrt(1 + w**(2*n)))
dB(x) = 20 * log10(abs(x))

# Gridlines
set grid

# Set x axis to logarithmic scale
set logscale x 10

# Set range of x and y axes
set xrange [0.001:1000]
set yrange [-60:10]

# Create x-axis tic marks once per decade (every multiple of 10)
set xtics 10

# Use 10 x-axis minor divisions per major division
set mxtics 10

# Axis labels
set xlabel "Angular frequency (rad/s)"
set ylabel "Gain (dB)"

# No need for a key
set nokey #0.1,-25

# Frequency response's line plotting style
set style line 1 lt 1 lw 2

# Draw a separator between passband and stopband and label them
set style line 2 lt 2 lw 1
set style arrow 2 nohead ls 2
set arrow 3 from 1,-60 to 1,10 as 2

# Label coordinates are relative to the graph window, not to the function, centered at the 1/4 and 3/4 width points
set label 1 "Passband" at graph 0.25, graph 0.1 c
set label 2 "Stopband" at graph 0.75, graph 0.1 c

# Asymptote lines and slope lines are the same "arrow" style
set style line 3 lt 3 lw 1
set style arrow 3 nohead ls 3

# Draw asymptote lines
set arrow 1 from 1,0 to 1000,-60 as 3
set arrow 2 from .001,0 to 1,0 as 3

# -3 dB arrow style and arrow
set style line 4 lt 4 lw 1
set style arrow 4 head filled size screen 0.02,15,45 ls 4
set arrow 4 from 2,3 to 1,0 as 4

# "Cutoff frequency" label uses same coordinates as the function
set label 3 "Cutoff frequency" at 2,4 l

# "-3 dB" label
set arrow 5 from 0.5,-6 to 1,-3 as 4
set label 4 "-3.01 dB" at 0.5,-7 r

# Draw slope lines and label
set arrow 6 from 100,-20 to 12,-20 as 3
set arrow 7 from 100,-20 to 100,-39 as 3
set label 5 "Slope: -20 dB/decade" at 100,-18 c

# Plot the filter response
plot
     dB(G(x,1)) ls 1  title "1st-order response"

unset output      # cleanup the handle
|


Lisénsi
Saya, pemilik hak cipta dari karya ini, dengan ini menerbitkan berkas ini di bawah ketentuan berikut:
Berkas ini dilisensikan dengan lisensi Creative Commons Atribusi-BerbagiSerupa 3.0 Tanpa Adaptasi, 2.5 Generik, 2.0 Generik, dan 1.0 Generik.
- Anjeun bébas:
- pikeun babagi – pikeun nyalin, nyebarkeun, sarta nyalabarkeun karyana
- pikeun nyampurkeun – pikeun ngarobah karyana
- Dumasar kana kaayaan di handap:
- atribusi – Anjeun kudu ngatribusi karya ku cara nu geus ditangtukeun ku nu nyieun atawa nu méré lisénsi (tapi lain ku jalan nu sigana téh maksa pikeun Anjeun maké éta karya).
- BabagiSarupa – Lamun anjeun ngadumaniskeun, ngarobah, atawa nyieun turunan tina éta bahan, anjeun kudu nyebarkeun kontribusi anjeun maké lisénsi anu sarua jeung nu aslina.

|
Widi dipaparinkeun pikeun nyalin, nyebarkeun jeung/atawa ngarobah ieu dokumén dina payung GNU Free Documentation License, Vérsi 1.2 atawa saluhureunana anu medal ti Free Software Foundation; tanpa Invariant Sections, tanpa Front-Cover Texts, jeung tanpa Back-Cover Texts. Salinan lisénsina diselapkeun dina bab GNU Free Documentation License. |
Anjeun bisa milih lisénsi nu cocog.
Log pengunggahan asli
This image is a derivative work of the following images:
- Image:Butterworth_response.png licensed with Cc-by-sa-3.0,2.5,2.0,1.0, GFDL
- 2005-07-23T17:45:55Z Omegatron 1240x880 (87607 Bytes) split the cutoff frequency markers
- 2005-07-23T16:31:54Z Omegatron 1250x880 (94570 Bytes) Better butterworth filter response curve
- 2005-06-26T19:54:33Z Omegatron 250x220 (2251 Bytes) A graph or diagram made by [[User:Omegatron]]. (Uploaded with Wikimedia Commons.) Source: Created by [[User:Omegatron]] {{GFDL}}{{cc-by-sa-2.0}} [[Category:Diagrams]]\
Uploaded with derivativeFX
Jujutan berkas
Klik dina titimangsa pikeun nempo koropak nu aya dina mangsa éta.
| Titimangsa | Miniatur | Ukuran | Pamaké | Kamandang | |
|---|---|---|---|---|---|
| kiwari | 25 April 2013 09.50 | | 512 × 384 (41 KB) | Incnis Mrsi | dehyphenation |
| 4 Juli 2008 23.17 |  | 512 × 384 (41 KB) | Krishnavedala | {{Information |Description=This is the en:SVG version of the en:PNG image created by en:User:Omegatron. I simply changed the terminal type from en:postscript to SVG in the en:GNUplot script file. The [[w:frequency response|frequency |
Pamakéan berkas
Ieu berkas dipaké ku kaca di handap:
Pamakéan berkas sajagat
Wiki lianna anu maké ieu berkas:
- Pamakéan di ca.wikipedia.org
- Pamakéan di cv.wikipedia.org
- Pamakéan di de.wikipedia.org
- Pamakéan di en.wikipedia.org
- Pamakéan di en.wikibooks.org
- Pamakéan di eo.wikipedia.org
- Pamakéan di es.wikipedia.org
- Pamakéan di et.wikipedia.org
- Pamakéan di fa.wikipedia.org
- Pamakéan di fi.wikipedia.org
- Pamakéan di ko.wikipedia.org
- Pamakéan di pt.wikipedia.org
- Pamakéan di simple.wikipedia.org
- Pamakéan di uk.wikipedia.org
- Pamakéan di vi.wikipedia.org
- Pamakéan di zh.wikipedia.org