
Gambar:Anscombe.svg

Berkas asli (Koropak SVG, nominalna 945 × 630 piksel, ukuranana 57 KB)
| Berkas ieu asalna ti Wikimedia Commons. Kaca ngeunaan katerangan berkas ieu di Commons aya disalin di handap. Commons téh hiji gudang berkas bébas nu eusina disumbang ku balaréa. |
Ringkesna
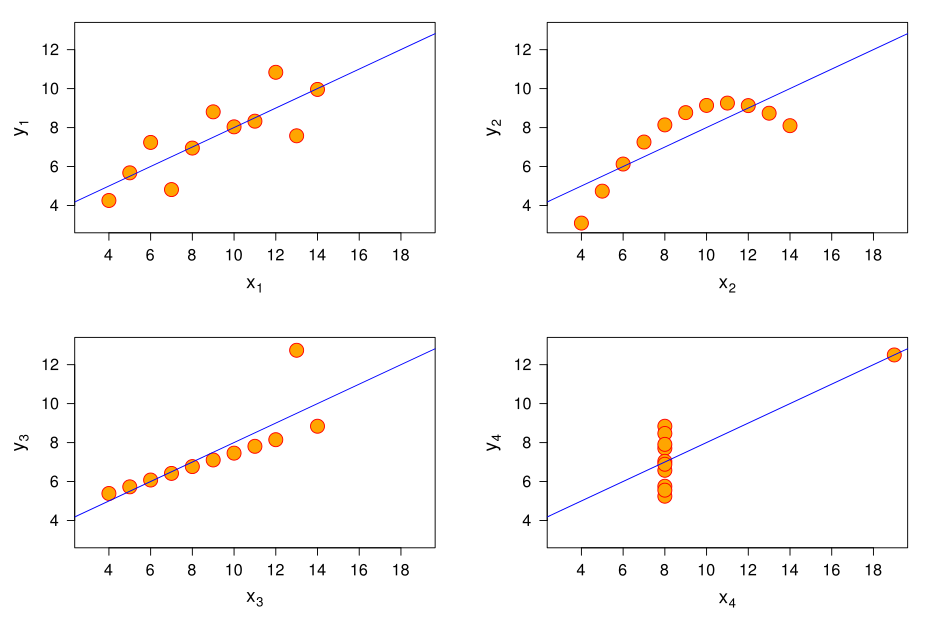
This graphic represents the four datasets defined by Francis Anscombe for which some of the usual statistical properties (mean, variance, correlation and regression line) are the same, even though the datasets are different.
| Property | Value |
|---|---|
| Mean of each variable | 9.0 |
| Variance of each variable | 11.0 |
| Mean of each variable | 7.5 |
| Variance of each variable | 4.12 |
| Correlation between each and variable | 0.816 |
| Regression line |


The graph was created by User:Schutz for Wikipedia on 13 June 2006 (and updated on 29 March 2010), using the R statistical project. The program that generated the graphic is given below; it is based on the example provided with the help page of the R dataset anscombe (accessible using the command data(anscombe); help and more information about the dataset is available using the command help(anscombe)), and was slightly modified to improve the result. The graph was directly exported in SVG format.
References:
- Anscombe, Francis J. (1973) Graphs in statistical analysis. American Statistician, 27, 17–21.
- R Development Core Team. R: A Language and Environment for Statistical Computing. R Foundation for Statistical Computing. Vienna, Austria. 2006. ISBN 3-900051-07-0. http://www.R-project.org
 svg("anscombe.svg", width=10.5, height=7)
 par(las=1)

 ##-- some "magic" to do the 4 regressions in a loop:
 ff <- y ~ x
 for(i in 1:4) {
   ff[2:3] <- lapply(paste(c("y","x"), i, sep=""), as.name)
   ## or   ff2 <- as.name(paste("y", i, sep=""))
   ##      ff3 <- as.name(paste("x", i, sep=""))
   assign(paste("lm.",i,sep=""), lmi <- lm(ff, data= anscombe))
 }

 ## Now, do what you should have done in the first place: PLOTS
 op <- par(mfrow=c(2,2), mar=1.5+c(4,3.5,0,1), oma=c(0,0,0,0),
           lab=c(6,6,7), cex.lab=1.5, cex.axis=1.3, mgp=c(3,1,0))
 for(i in 1:4) {
   ff[2:3] <- lapply(paste(c("y","x"), i, sep=""), as.name)
   plot(ff, data =anscombe, col="red", pch=21, bg = "orange", cex = 2.5,
        xlim=c(3,19), ylim=c(3,13),
        xlab=eval(substitute(expression(x[i]), list(i=i))),
        ylab=eval(substitute(expression(y[i]), list(i=i))))
   abline(get(paste("lm.",i,sep="")), col="blue")
 }

 dev.off()
Lisénsi
The R project is licensed under the GPL [1]; since this image is a derived work of an example script provided with R, it is also licenced under the GPL.
However, all modifications made by User:Schutz are also licensed under the CC-BY-SA licence.

|
Karya ini adalah perangkat lunak bebas; Anda diizinkan untuk mendistribusikan dan/atau memodifikasi dokumen ini di bawah syarat-syarat Lisensi Publik Umum GNU yang diterbitkan oleh Free Software Foundation; Versi 2 atau lebih baru. Karya ini didistribusikan dengan harapan dapat berguna, tetapi tanpa jaminan apa pun; bahkan tanpa jaminan jual beli atau kesesuaian untuk tujuan tertentu. Lihat versi 2 dan versi 3 dari Lisensi Publik Umum GNU untuk informasi lebih lanjut. |
Derivative works
Karya turunan dari berkas ini:
Jujutan berkas
Klik dina titimangsa pikeun nempo koropak nu aya dina mangsa éta.
| Titimangsa | Miniatur | Ukuran | Pamaké | Kamandang | |
|---|---|---|---|---|---|
| kiwari | 29 Maret 2010 15.10 | | 945 × 630 (57 KB) | Schutz | |
| 15 Januari 2007 00.07 |  | 990 × 677 (88 KB) | Schutz | ||
| 15 Januari 2007 00.05 |  | 990 × 677 (88 KB) | Schutz | ||
| 13 Juni 2006 21.37 |  | 1.044 × 750 (94 KB) | Schutz | ||
| 13 Juni 2006 18.27 |  | 1.125 × 875 (94 KB) | Schutz |
Pamakéan berkas
Ieu berkas dipaké ku kaca di handap:
Pamakéan berkas sajagat
Wiki lianna anu maké ieu berkas:
- Pamakéan di ca.wikipedia.org
- Pamakéan di da.wikipedia.org
- Pamakéan di en.wikipedia.org
- Pamakéan di es.wikipedia.org
- Pamakéan di eu.wikipedia.org
- Pamakéan di fi.wikipedia.org
- Pamakéan di fr.wikipedia.org
- Pamakéan di fr.wikiversity.org
- Pamakéan di he.wikibooks.org
- Pamakéan di hu.wikipedia.org
- Pamakéan di nl.wikipedia.org
- Pamakéan di nl.wiktionary.org
- Pamakéan di nn.wikipedia.org
- Pamakéan di no.wikipedia.org
- Pamakéan di ru.wikipedia.org
- Pamakéan di tr.wikipedia.org
- Pamakéan di uk.wikipedia.org
- Pamakéan di www.wikidata.org